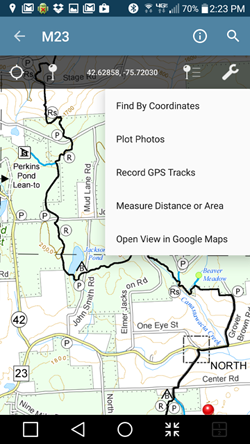
On the interactive maps, click on a segment of the main or branch trails to display an elevation profile. You can also click on the ![]() and
and ![]() symbols or the map border to display the elevation profile for the map.
symbols or the map border to display the elevation profile for the map.


Elevation profiles can give you a good idea of what your planned hike will be like. As you probably know, changes in elevation can dramatically affect the effort involved in a hike. Hikers know that a one mile walk on a flat, paved trail is a lot different from one that is on a varied, natural surface with several hundred feet of elevation change. Some say that 1,000 feet of vertical change adds the equivalent of one mile of length to your hike. Elevation change adds quickly to the exercise value of your hike. And it also may get you to places with longer, bigger views. Whether the change is up or down, elevation change can make your hike more interesting and valuable.
But you need to know how to view the elevation profiles as the following will illustrate.
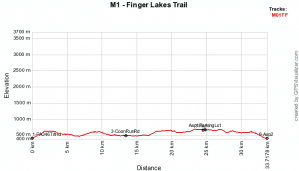
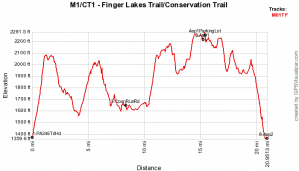
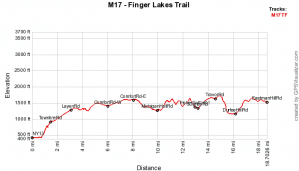
The profiles above are for the same hike! Only the vertical scale has been changed. On the left, the vertical scale is the minimum and maximum elevations found on the entire Finger Lakes Trail system (400 ft to 3,700 ft). With this scale, you can compare this hike to your experience with other hikes along the FLT system. On the right, the scale is the maximum and minimum elevation on just this hike (1,360 ft to 2,280 ft). With this scale, you can see the details of the climbs and descents, but it is difficult to compare with other hike profiles with different scales.
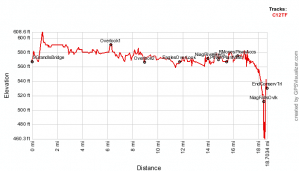
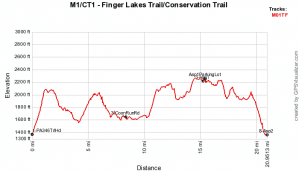
These profiles are for very different hikes! The one on the left is an easy hike which most people would classify as “level.” The one on the right has some serious up and down that will challenge most hikers. The vertical scale on the left is only 50 feet while the vertical scale on the right is 3,300 feet.
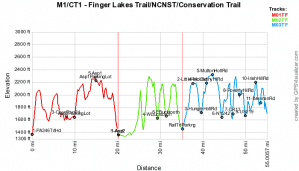
The red tracks in the above profiles are for the same hike, but the hills look a lot steeper in the profile on the left even though the elevations are the same. The horizontal scale on the left is 55 miles but only 20 miles on the right.
So you can’t tell the height of the hills or the steepness from just looking at the shape of the profile curve. Make sure that you check both the vertical and horizontal scale of elevation profiles before you decide that a hike is right or not right for you.


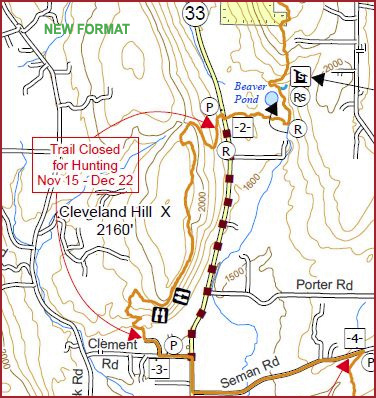
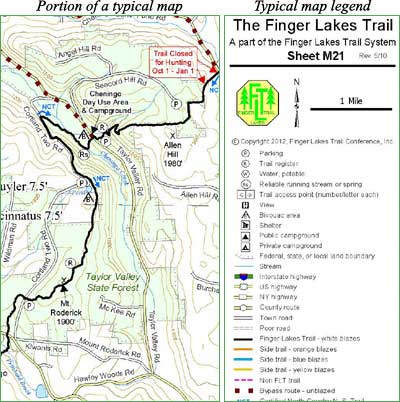
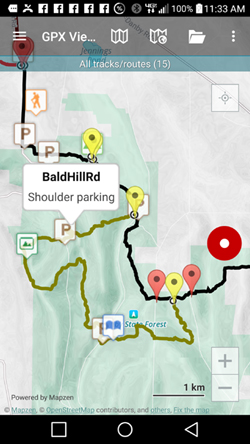
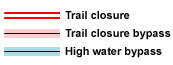 This is an overview map of the Finger Lakes Trail System. It shows tracks of the main trail, branch trails, loops and spurs. The track colors represent the blaze colors for the branch trails, loops, spurs, and sections of the main FLT not blazed in white. Most of the main FLT is depicted in black & white for better visibility on various map backgrounds, but blazed in white on the ground. Trail closures (hunting, logging, etc.) and recommended bypass routes are depicted as shown at right. Hover over a track to display the name and length. Tracks colored
 This is a overview map of the Finger Lakes Trail System. It shows tracks of the main trail, branch trails, loops and spurs. The track colors represent the blaze colors for the branch trails, loops, spurs, and sections of the main FLT not blazed in white. Most of the main FLT is depicted in black & white for better visibility on various map backgrounds, but blazed in white on the ground. Trail closures (hunting, logging, etc.) and recommended bypass routes are depicted as shown at right. Hover over a track to display the name and length. Tracks colored